
Get an EDGE on your Trading
We Became Market Structure Experts So You Don’t Have To
Market Structure EDGE Makes the Complex Simple
US equity market rules are complex: Reg NMS, Rule 605 and 606, order types, options. The most sophisticated traders know how to navigate the market, but how do you get an EDGE on profitable trades?
Market Structure EDGE condenses complex equity market rules and central tendencies into two simple metrics: Market Structure Sentiment (Demand) and Short Volume (Supply). It’s not headlines, not mass psychology, not technical indicators, or how research analysts rate stocks. It’s the simplest economic concept: Supply and Demand.
Built for traders, investors, both retail and buy-side. Use EDGE for decision-support for better entries and exits. We are democratizing Market Structure for everyone.

3 Core Concepts
Market Structure Sentiment (Demand) tracks the way rules governing stock trades signal opportunity or risk. It’s a 10-point scale metering how stocks move from Oversold (1) to Overbought (10). Search for stocks with Demand trending up, especially over 5.0.
Short Volume (Supply) is the percentage of trading volume driven by borrowed rather than owned shares. Generally, short volume over 50% hinders gains. And stocks with Demand over 5.0 and down-trending Supply outperform.
Practice risk management by monitoring Broad Market Sentiment trends, back-testing trade assumptions with our Profiler, and navigating around market-structure events like options expirations.
Real-world Examples
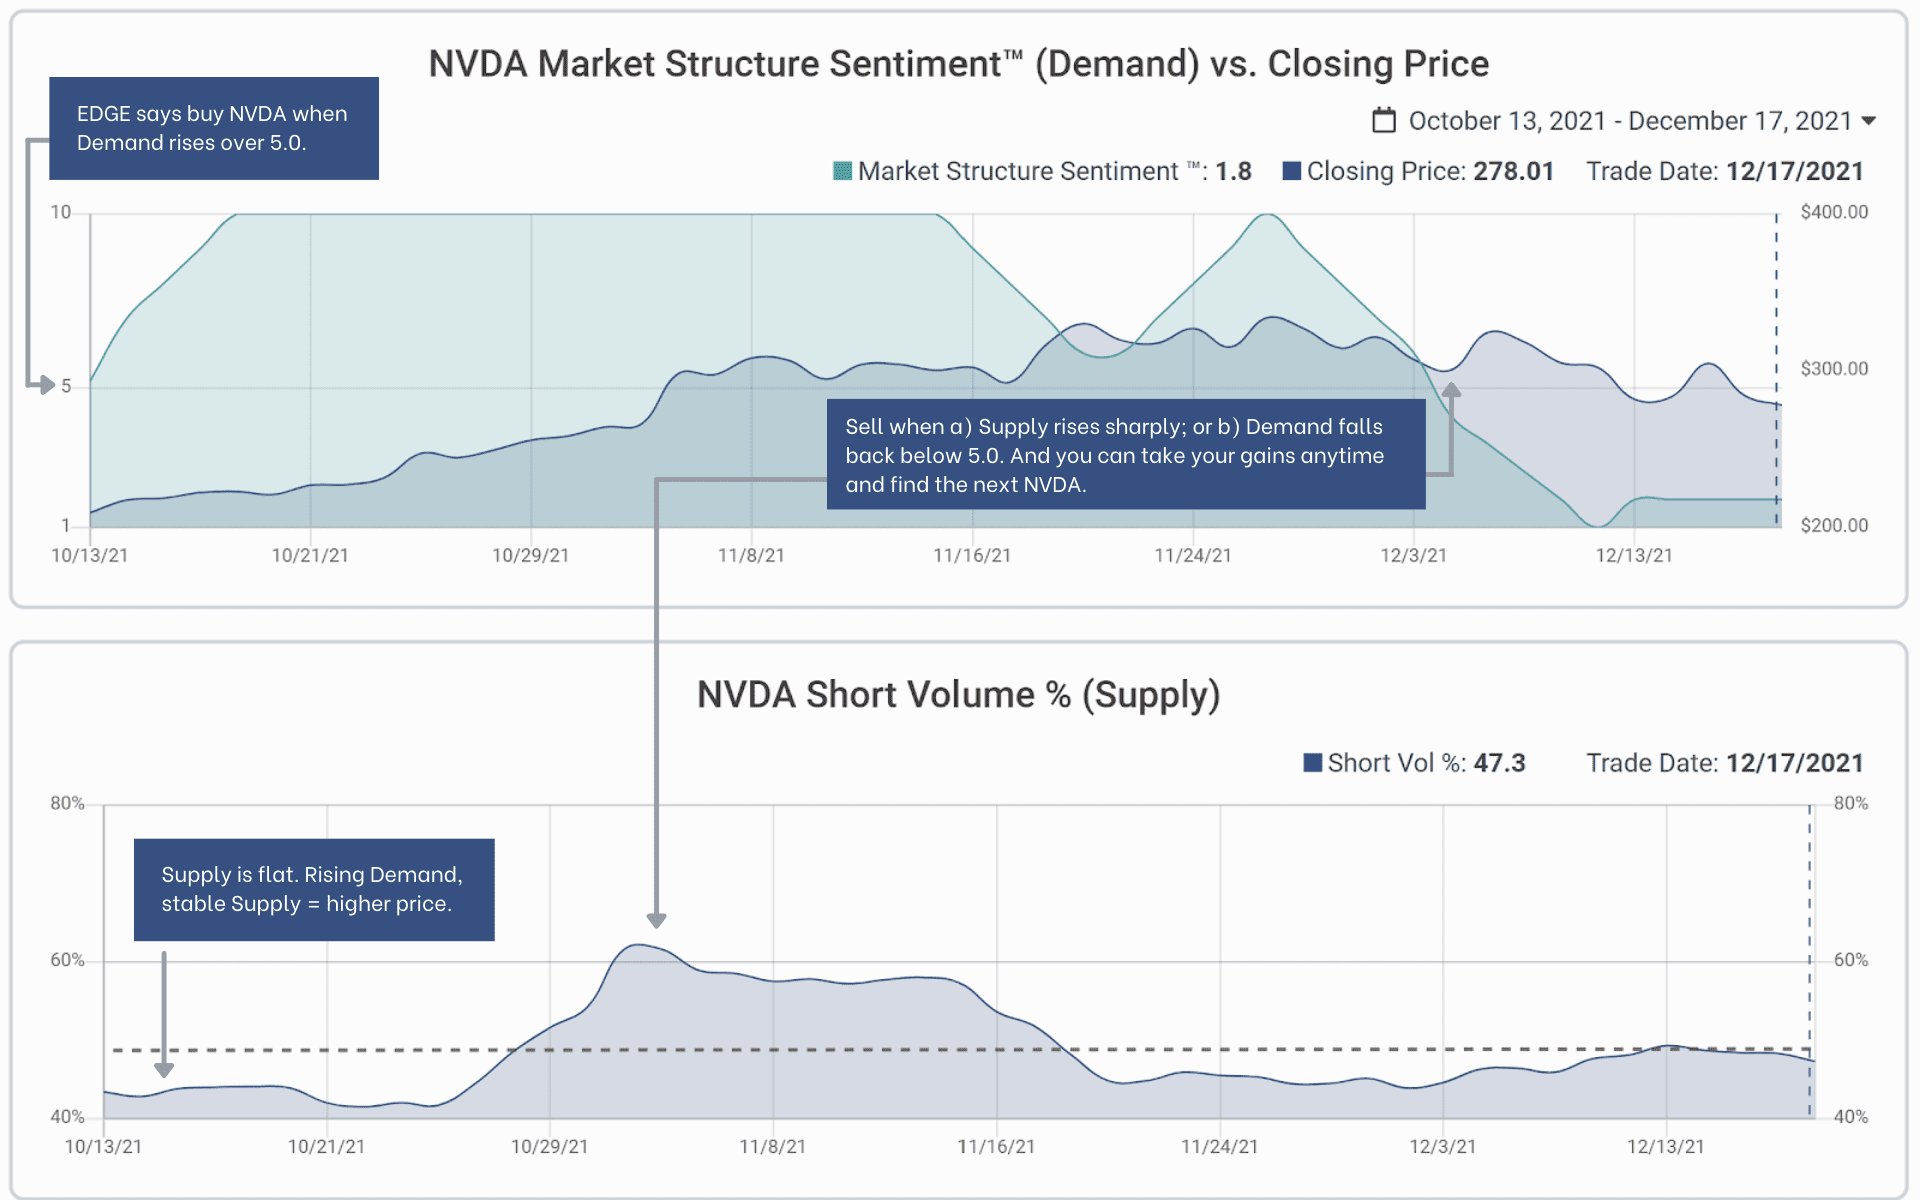
Example #1: Entries and Exits in NVDA
Don’t trade PRICE. Trade SENTIMENT. Or more simply, trade Demand and Supply. Don’t just randomly buy Nvidia (NVDA). Buy when Demand is surging, especially when Demand rises over 5.0. Sell when Supply jumps, or Demand falls back below the nexus of 5.0.
It’s not WHAT you buy or sell that breeds success. It’s WHEN you do it.
WINNER: Buy when Demand surges over 5.0.
Example #2: Check Supply and Demand before Trading Companies Reporting Earnings
Stocks may move differently than you expect because of Supply/Demand imbalances (or because the buyers or sellers have purposes that don’t reflect the company’s financial results).
LOSER: NVDA might report great earnings. But if the Supply/Demand balance looks like this, the stock will fall. Know beforehand!

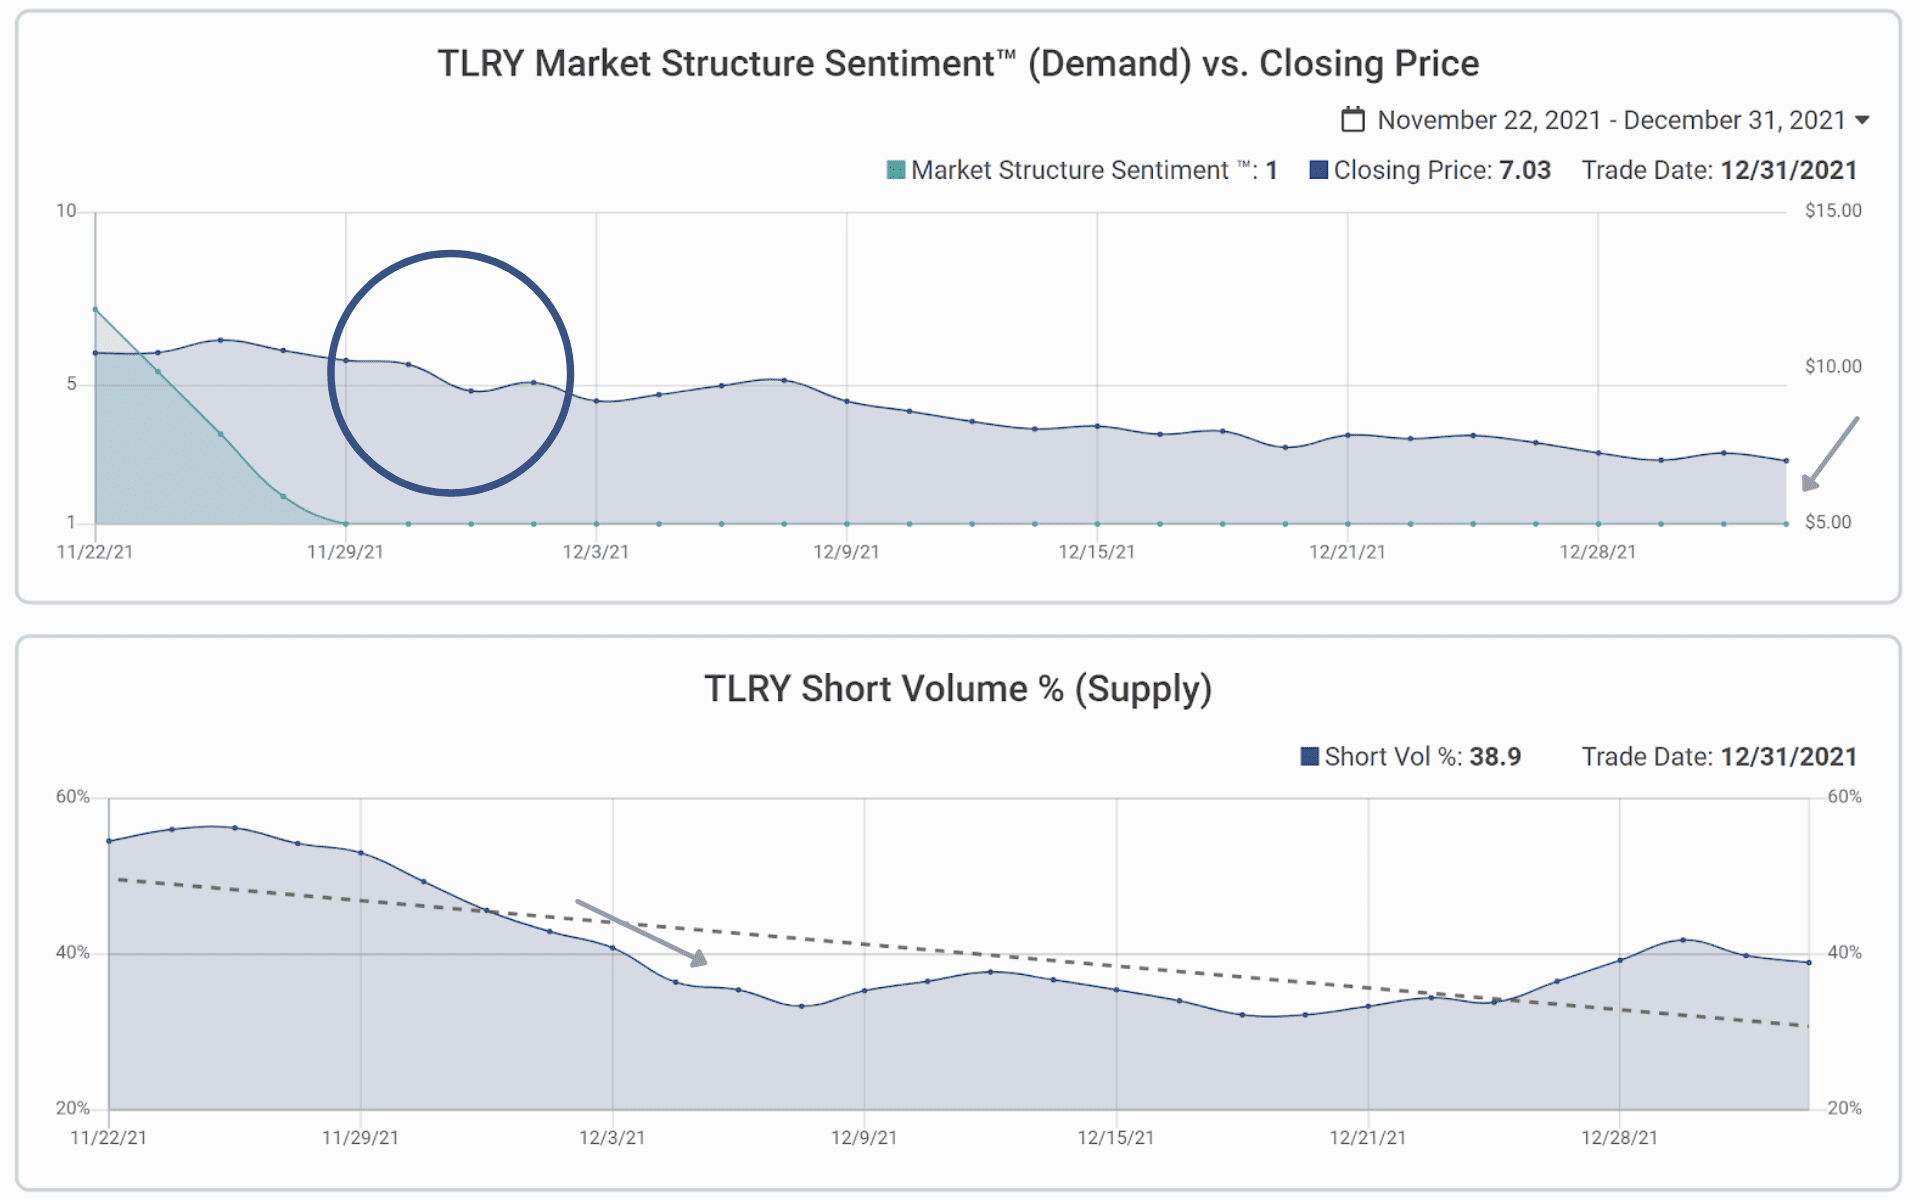
Example #3: Avoid Losers
You love Cannabis stocks and you want to trade TLRY. It’s early December 2021 and the stock starts to rise. Time to buy?
Nope.
EDGE will show you that the reason the stock is up is falling Supply – but Demand is on the floor, 1.0. And the stock declined the whole time. Buy rising Demand. Otherwise, the odds are stacked against gains. Don’t be fooled!
Example #4: Winning in Volatile Markets
Trade stable Demand when the market is volatile. In January and February 2022, the market was volatile and falling. But Philip Morris (PM) had Demand at 5.0 or better the entire time. And Supply periodically declined. Result? PM rose 13% between Jan 7-Feb 18, when the broad market declined 7% — a 20% difference.

Example #5: Screen for the Best Stocks in Volatile Markets
How do I find stocks like PM with EDGE? Screen for them! The EDGE search criteria here form a dynamic portfolio that gives us a new daily list of large cap stocks spending a lot of time with Demand at 5.0 or better, that are liquid and stable.

Example #6: Know When Stocks Like TSLA are Likely to Rise
When demand returns to stocks like TSLA (here from Aug to mid-Nov 2021), own them over 5.0, and sell when Demand falls below 5.0, or Supply jumps up.

Example #7: Trading Short-Term With EDGE
Can I trade short-term with EDGE? You bet. Use EDGE to find diverging Supply and Demand, and take gains (not chances!) fast.
